Alignment Strategies for a Variety of Instruments & Data Types
 SA’s flexibility allows users to include data from a variety of different instruments all within the same job file; however, it can be daunting to find ways to align data of significantly different types in order to use it for analysis and reporting. Read on to learn how SA’s helpful tools can turn this into a simple and easy process.
 Alignment Strategies for a Variety of Instruments & Data Types
SA’s flexibility allows users to include data from a variety of different instruments all within the same job file; however, it can be daunting to find ways to align data of significantly different types in order to use it for analysis and reporting. Read on to learn how SA’s helpful tools can turn this into a simple and easy process.
Let’s consider an example in which a part is scanned using a laser scanner so that a point cloud of the entire part is created, and particular features of that same part are also measured to higher precision with a laser tracker. The challenge in aligning point cloud data is to define features of a size or position with enough accuracy to be directly comparable to the tracker’s point measurements. This can be done in a number of ways, but one convenient way is to add a few registration spheres to the scanned region.
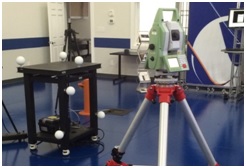
Figure 1. Scanned Spheres on table
Sphere Center Auto-Detection
Sphere Center Auto-Detection is a very useful and powerful command that will walk you through a point cloud and detect all the spheres of a given size and tolerance within that cloud. If you place six registration spheres on or around your part, you can then use this command to find the spheres and detect their center locations in one step. This command can be found under Construct>> Points>> From Cloud Points>> Auto-Detect Sphere Centers.
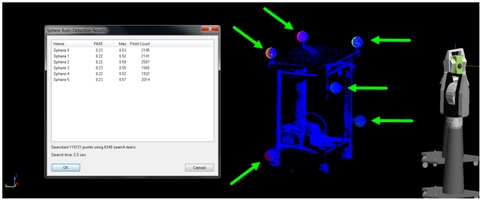
Figure 2. Auto-Detect Sphere Centers
SA Toolkit Sphere Construction
Once you have extracted the sphere centers from the scan data, you will need to measure the same locations with the tracker. The easiest way to do this is by using the SA Toolkit. Once connected to the tracker, you can simply press the sphere button to add a sphere, measure surface points, and then add another one. The spheres will update automatically with each measurement, refining the location of its center points. When finished, go to any one of the sphere’s properties and edit the cardinal points to place them in a specified point group, then apply these settings to all the other spheres (this will ensure that all the center points of the spheres will be in the same group).
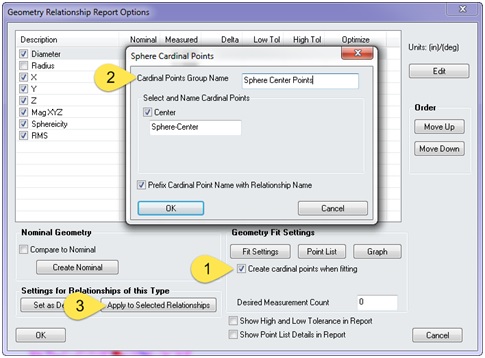
Figure 3. Sphere Relationship Properties
Rename Points using Inter-point Distance
In order to align the sphere centers extracted from the cloud with the ones measured with the tracker, the names of the points must to match up. SA’s most helpful tool for renaming points for this purpose can be found under: Edit>> Rename>> Points by Auto-Corresponding 2 Groups>> Inter-Point Distance. This brilliant utility can build a matrix of individual distance between the points contained in the group and use these distances to compare the points to the corresponding group. Unless your data is perfectly symmetrical, this command can nearly perfectly correspond the two groups regardless of the alignment of those point groups.
Group to Group Relationship for Alignment
At this point, the sphere centers can be fit together. You could use a simple best-fit to accomplish this; however, adding a Group to Nominal Group Relationship and using it for alignment provides a couple of additional benefits. First, it creates a dynamic link between the individual points which is updated continually in a customizable report table:
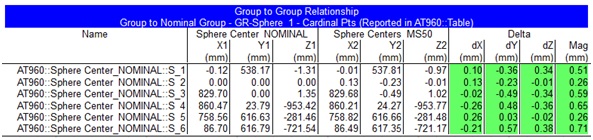
Figure 4. Group to Nominal Group Report Table
A second advantage is that you can turn on an auto-vector group just by checking a box in the relationship properties that will display the deviations between each of the individual points in a graphical display. This can be particularly helpful if you want to perform additional alignments because it will immediately notify you graphically if you have changed the alignment of two groups, and prevent mistakes before they take place.
Running a Relationship Optimization While Holding Level
In order to perform the Optimization and align your instruments together, simply right-click on the instrument you would like to move and choose “Locate” by using “Minimizing Relationships.” When working with scan data, the instruments may have already been leveled very carefully and the deviations could be important. For this reason, it is critical to hold the current level orientation of your instrument while performing the alignment. To do so, first ensure that the level frames of the instruments are aligned with the working frame (if not, you can use Instrument>>Straighten) and then simply restrict the degrees of freedom used in the transformation (allowing translation in X, Y, Z and rotation about ![]() , no rotation about
, no rotation about ![]() ,
, ![]() ).
).
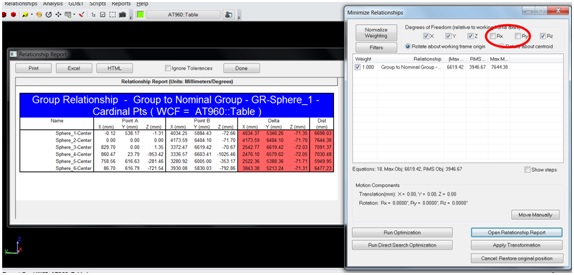
Figure 5. Minimizing Relationships
After “minimizing the relationship,” the deviations between the corresponding points will be minimized, which can be seen visually with the auto-vector group and in a tabular form in the report bar. Precise comparisons can then be made between the scan data and the tracker measurements.
Questions? Do you have any hints or tips of your own that you’d like to share? Contact NRK at support@kinematics.com.
Sign up to receive our eNewsletter and other product updates by clicking here.